Score 46.5 out of 100
State Park
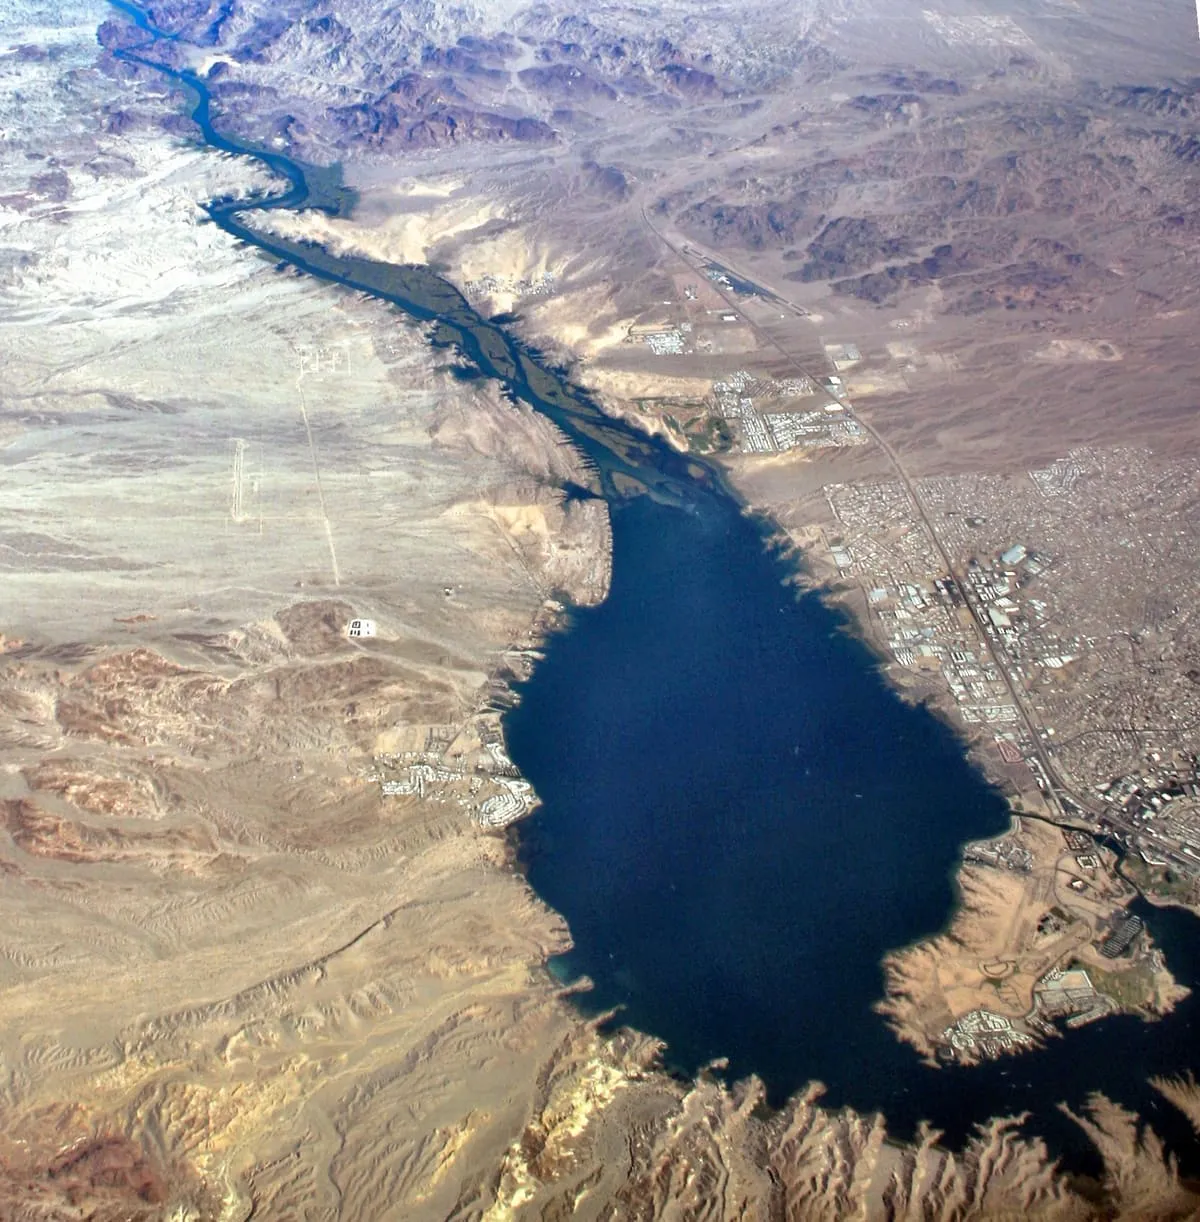
Lake Havasu State Park
A recreation area on the Colorado River reservoir at Lake Havasu City, with camping, boating and fishing.
Articles
Arizona's 32 state park units recorded 3,122,079 visits in 2024, and the five busiest accounted for 53 per cent of them.
The Arizona state park system comprises 32 units: 21 state parks, nine state historic parks and two state natural areas. Twenty-nine of them published a 2024 visitor count through the Arizona Office of Tourism, which compiles monthly returns supplied by Arizona State Parks. Those 29 units recorded 3,122,079 visits between them.
The figure is not distributed evenly across the system, and the shape of that distribution is the most useful thing the data says. Five units account for just over half of all recorded visits. The fifteen units in the lower half of the table account for a tenth.
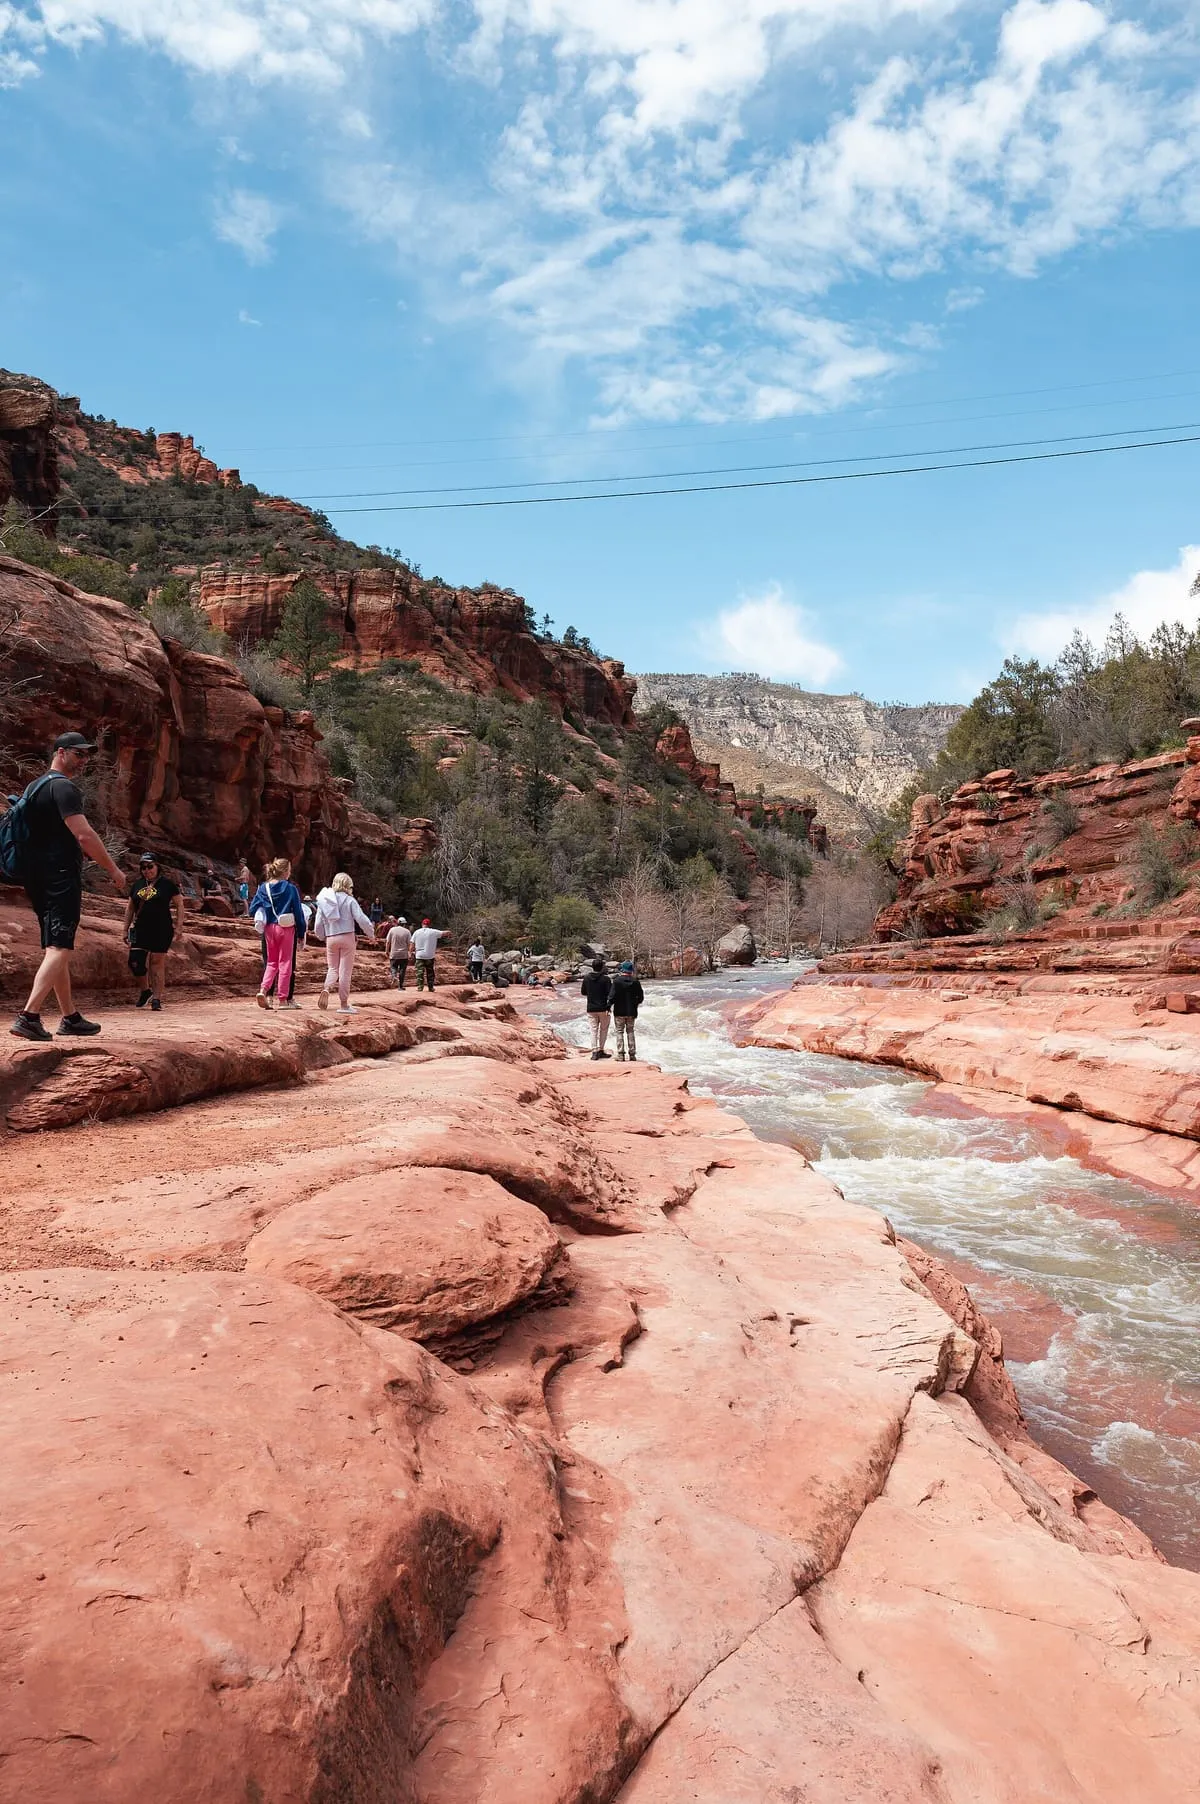
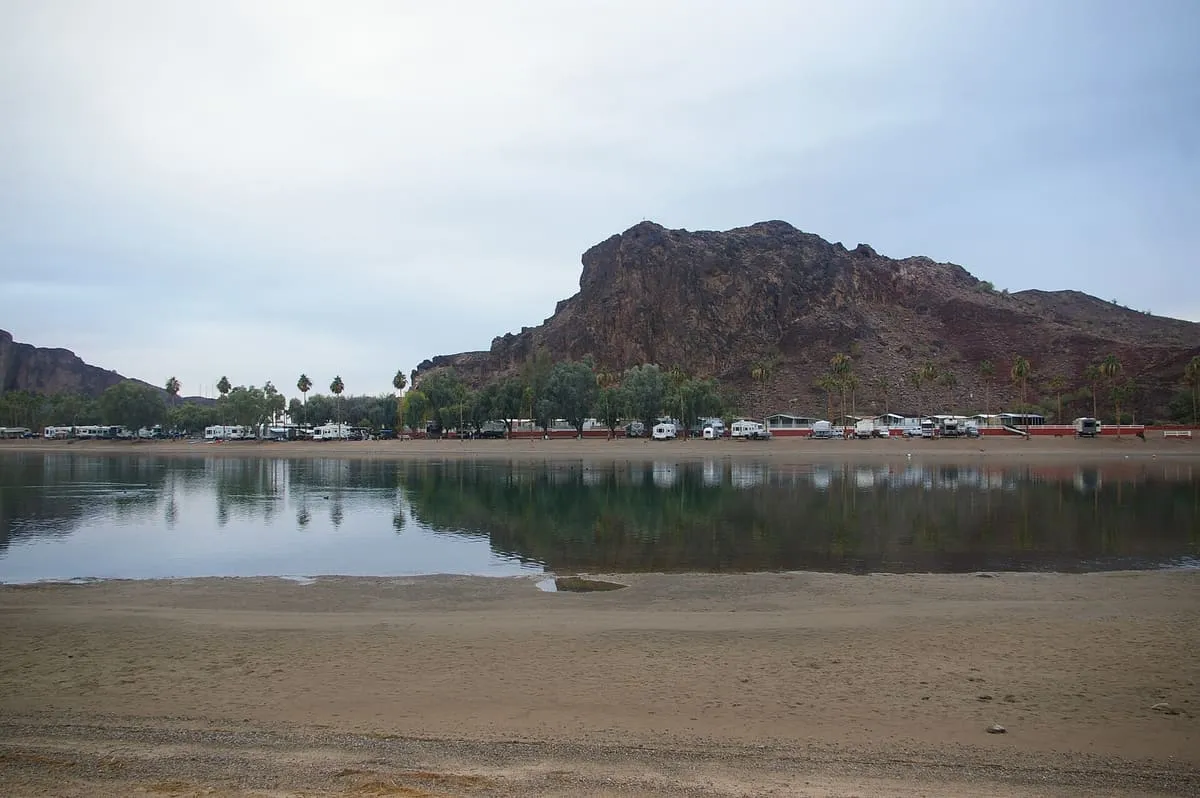
Lake Havasu State Park, on the Colorado River in Mohave County, recorded 468,535 visits in 2024. Slide Rock State Park, a creek site in Oak Creek Canyon north of Sedona, recorded 467,016. The difference is 1,519 visits, or 0.3 per cent of either figure.
The two have little in common beyond the total. They sit in different counties, at opposite ends of the state, and are visited for different reasons. Any ranking that places one above the other is reporting a margin narrower than the year-to-year variation in either park’s own record.
Behind the top two, Catalina State Park recorded 281,405 visits, Patagonia Lake State Park 235,502 and Dead Horse Ranch State Park 206,069. Those five units together account for 53.1 per cent of the system total.
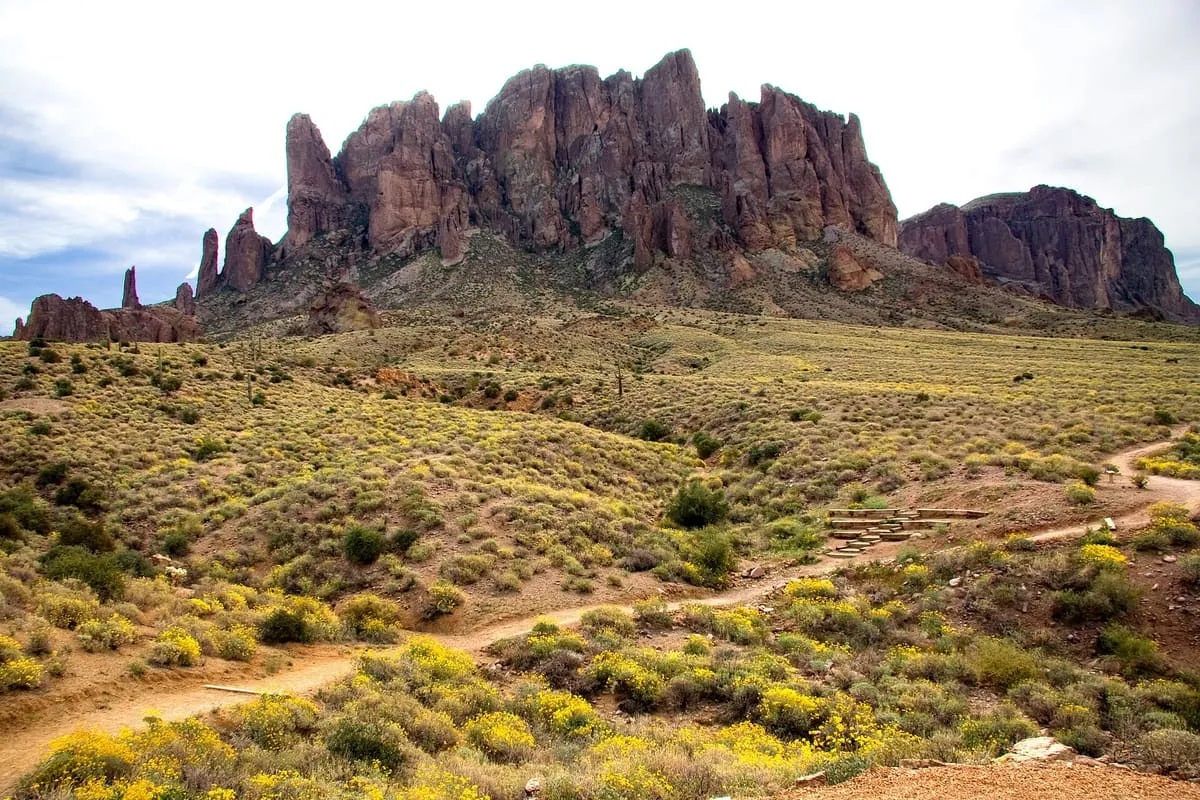
The sixth, Lost Dutchman State Park, recorded 205,384 — 685 visits behind Dead Horse Ranch, another margin too narrow to carry meaning.
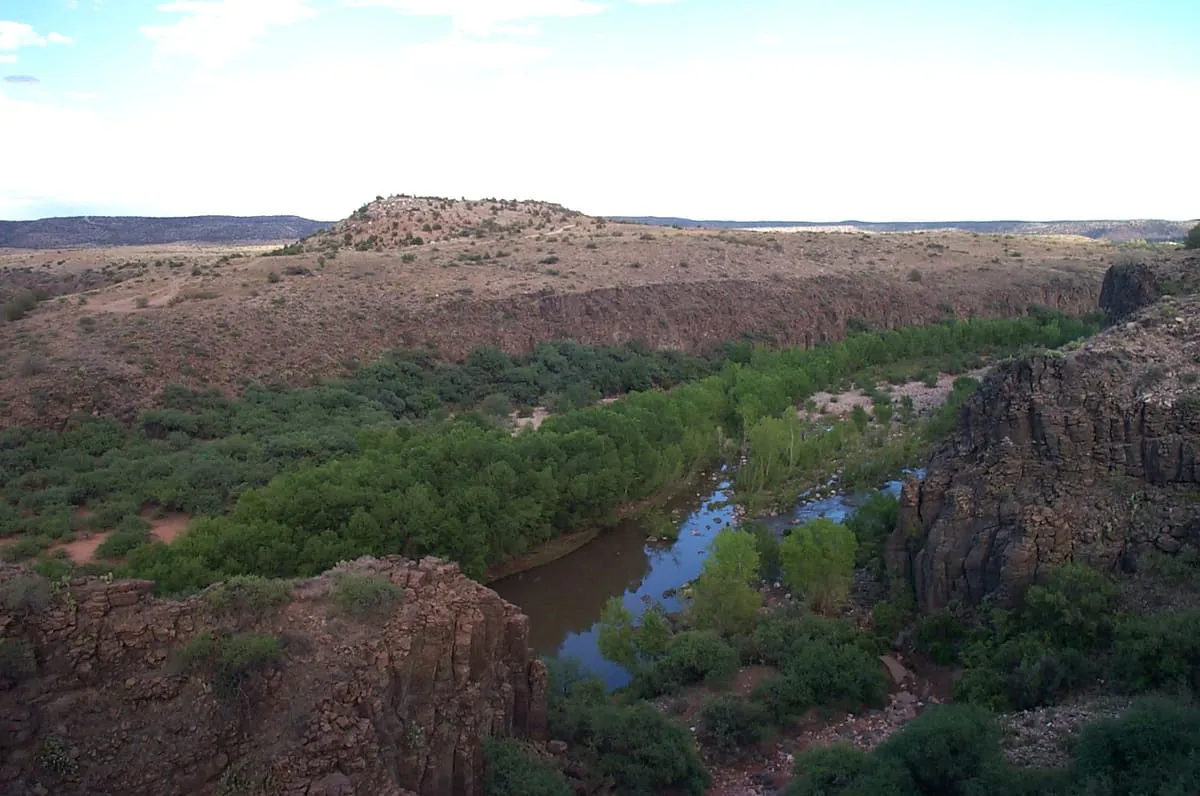
Below that the figures fall away quickly. The median unit, Buckskin Mountain State Park, recorded 62,681 visits, a seventh of the leader’s total. The fifteen units below the midpoint account for 10.7 per cent of the system between them. The largest published figure is 73 times the smallest, which is Rockin’ River Ranch State Park, a day-use park at the confluence of West Clear Creek and the Verde River, at 6,429.
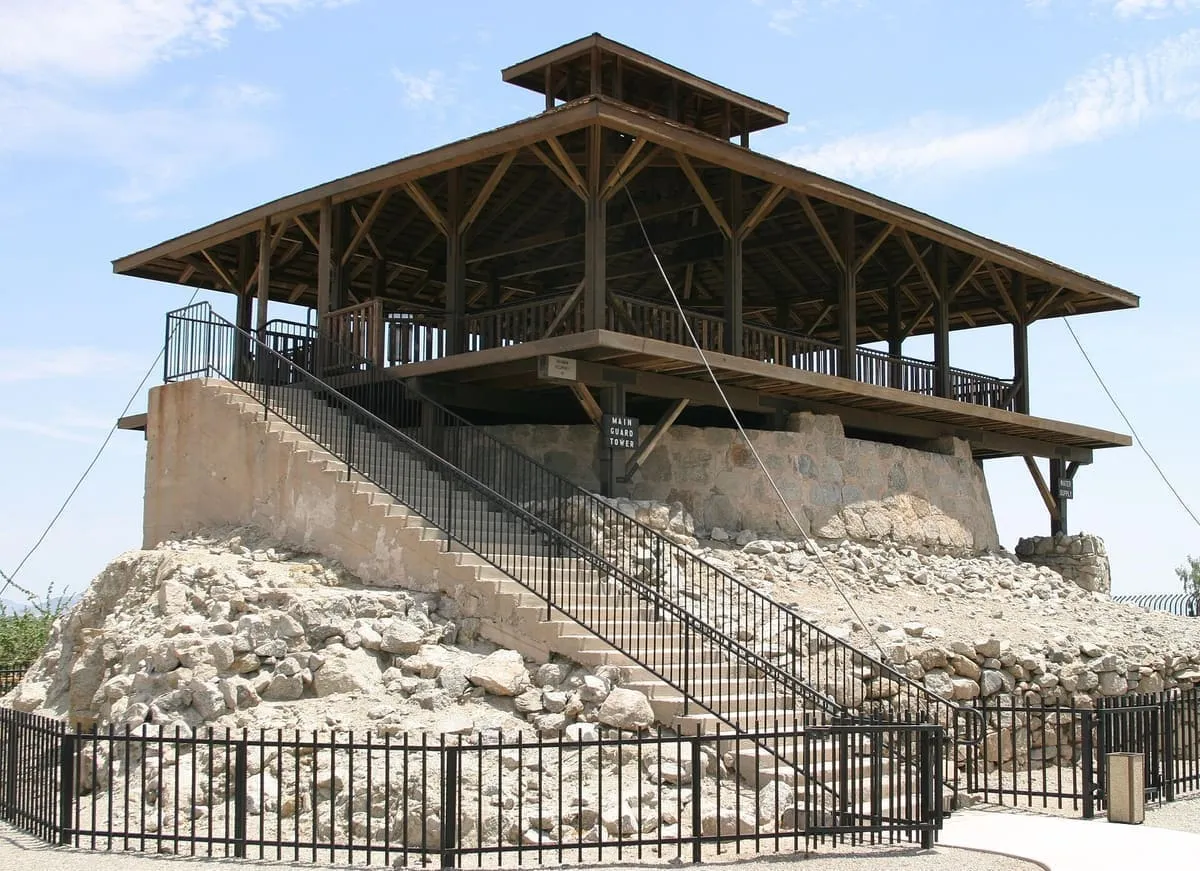
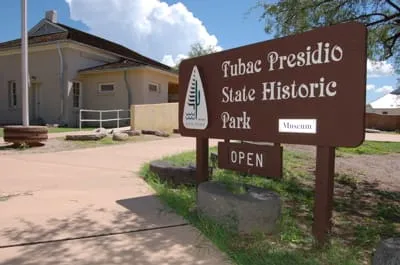
The nine state historic parks recorded 210,804 visits between them in 2024, which is 6.8 per cent of the system total and less than half of what Lake Havasu recorded on its own. The largest is Yuma Territorial Prison at 51,262, which places it sixteenth among all units. The smallest is Tubac Presidio State Historic Park at 7,256.
The gap is one of kind before it is one of appeal. Eight of the nine historic parks are built around a single structure or site — a prison, a mansion, a courthouse, a fort — while the five largest state parks are lakes, rivers and canyons. A visitation table that ranks the two classes together sorts them by what they are before it sorts them by anything else.
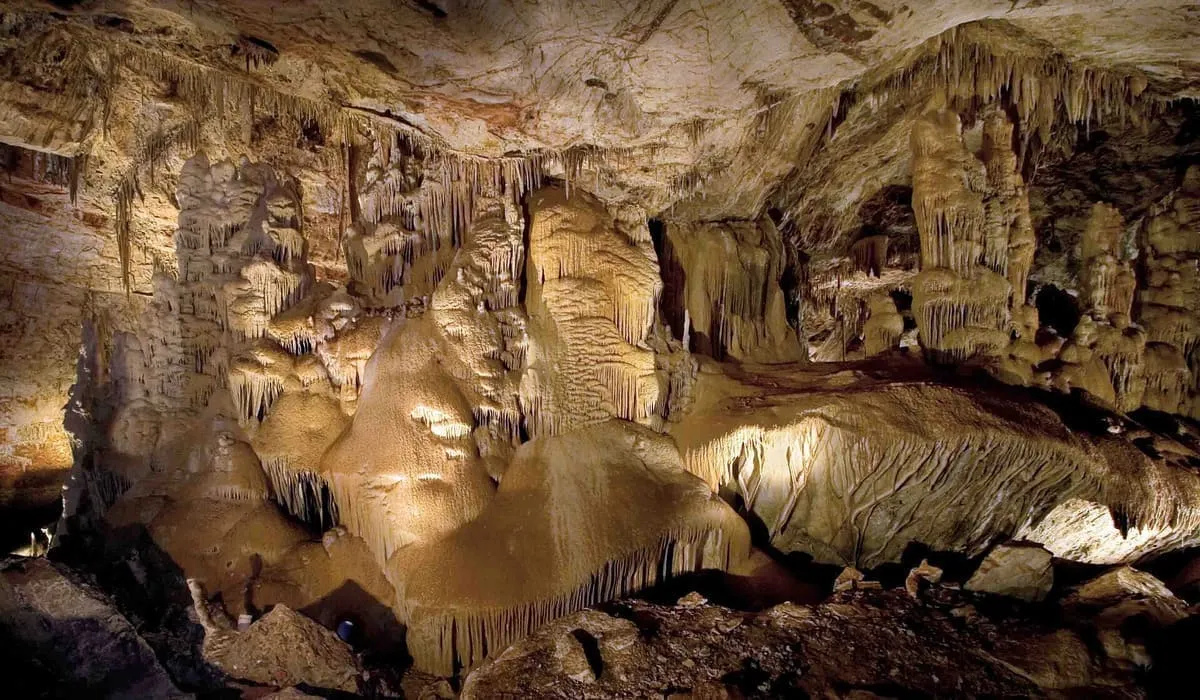
Kartchner Caverns State Park recorded 155,562 visits, seventh in the system. It is the one unit whose figure is bounded by something other than demand: the park is built around a live show cave, visitors enter through airlock doors that hold the cave’s humidity in, and access is by guided tour only. Its total is a function of tour capacity across the year. A higher figure would require a different park, not a more popular one.
The three units without a 2024 count are Dankworth Pond State Park, Verde River Greenway State Natural Area and Sonoita Creek State Natural Area.
In each case the explanation is administrative rather than a gap in the data. Dankworth Pond is a subunit of Roper Lake State Park. Verde River Greenway is administered as a unit of Dead Horse Ranch State Park. Sonoita Creek is entered on a pass obtained at the Patagonia Lake State Park entrance station. Each of the three parent units publishes a count, and visitors to the three are recorded there. The system total above is not missing them; it does not report them separately.
The figures are visits, not visitors, and they are counts of entries to a unit over the calendar year. They are compiled by the Arizona Hospitality Research and Resource Center from returns supplied by Arizona State Parks, and published by the Arizona Office of Tourism in its monthly state park visitation report. Every figure quoted here is that source’s, for 2024, and appears on the record page for each park with the same attribution.
This site keeps visitation separate from its other two measures for the reason this article demonstrates: a visitation table answers how many people were recorded entering a place, which is a narrower question than which places are worth visiting. How the three measures combine is set out on the methodology page.
State Park
State Park
State Park
State Park
State Park
State Park
State Park
State Historic Park
State Historic Park
State Park
State Park
State Park
State Natural Area
State Natural Area